
FFT
A continuous spectrum for exact frequencies: a hum, a whistle, the peak of a resonance.
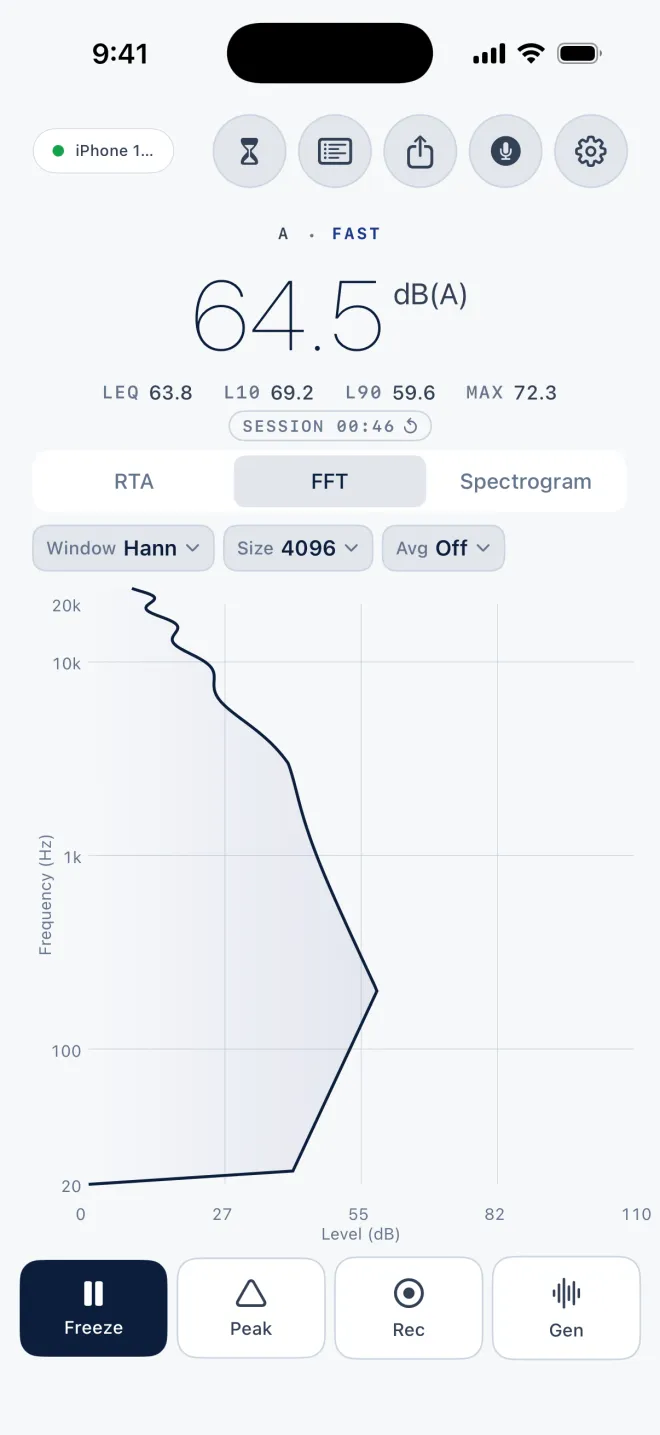
Where the RTA groups sound into bands, the FFT draws one continuous line across every frequency. It is laid out like the RTA, frequency up the side and level across, so switching between the two keeps your bearings.
Use it when you need the frequency: the pitch of a hum, a feedback whistle, the exact peak of a room mode.
Press and hold on the chart, then drag. A cursor follows your finger and shows the frequency and level under it, for example 120 Hz · 54.2 dB. Let go and it disappears.
Three chips above the chart set how the spectrum is computed:
WindowHann(free), plusHamming,BlackmanandBlackman-Harriswith Pro. Different trade-offs between sharp peaks and low leakage; Hann is a good default.Size4096(free), and with Pro anything from1024to65536. Larger sizes resolve closer frequencies but react more slowly.AvgOff(free), or with ProOn (Exponential), which smooths the line so a steady sound reads as a steady curve.
Peak and Freeze work here too: peak hold draws a fainter second line along the highest level each frequency has reached.
Related
- Real-time analyserThe sound split into fractional-octave bands from 20 Hz to 20 kHz, drawn as bars you read from the bottom up.
- SpectrogramFrequency over time, as a 3D waterfall you can turn or a flat rolling heatmap, so you can see how a sound changes, not just where it sits.
- ExportTake a measurement out of the app as a picture, a spreadsheet or a one-page report.
Still stuck? Write to zhi@nonoaudio.com. Support page