
Real-time analyser
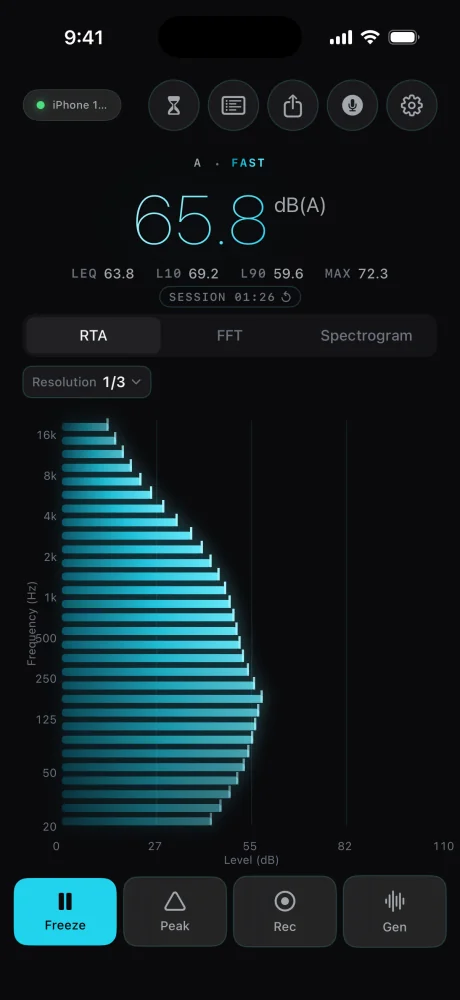
The sound split into fractional-octave bands from 20 Hz to 20 kHz, drawn as bars you read from the bottom up.
The RTA splits what the microphone hears into bands and shows how loud each one is. SoundMess Lab draws it on its side: frequency runs up the left edge, from 20 Hz at the bottom to 20 kHz at the top, and each bar's length is the level of that band, 0 to 110 dB across the bottom.
It is the view for "where is the energy": a boomy room shows long bars low down, a hiss shows up at the top.
Views
RTA, FFT and Spectrogram. On iPhone, swipe the chart to switch.
Bands
1/3-octave bands, 20 Hz at the bottom.
The Resolution chip above the chart sets how wide each band is. 1/3 octave is free and is the standard for room and noise work. With Pro you can go finer, to 1/6, 1/12 or 1/24, to pick out individual resonances.
Bars are drawn brighter or fainter depending on how far the microphone can be trusted at that frequency. On a phone's built-in microphone the lowest and highest bands come out faded. That is deliberate, see How far to trust it.
Every bar ends in a small pale tick. Tap Peak in the toolbar and the ticks stay at the highest level each band has reached while the bars keep moving. Tap Peak again to turn it off; the held peaks are cleared, so the next time starts fresh.
Freeze stops the chart and the readout on the current moment so you can read it. Tap Resume to go live again.
Related
- FFTA continuous spectrum for exact frequencies: a hum, a whistle, the peak of a resonance.
- How far to trust itPhone microphones are good in the middle and unreliable at the ends. SoundMess Lab shows you which is which.
- Free & ProThe meter and the analysers are free for good. Pro is one purchase for the rest.
Still stuck? Write to zhi@nonoaudio.com. Support page